Greetings,

I have a Teltonika GPS connected to Flespi. Then I stream the data to thingsboard because I will do some analytics using the Thingsboard Rule Chain. Periodically the GPS will send data to Flespi.

But the problem is sometime there is a network issue, so there will be a delayed data. Moreover, my analytics is a state based, it means the calculation depends on the value of the previous data.

Let say there are 15 data from t=0 to t=14. Sometimes, I get the t=10 data for now, but due the network issue the t=7 data just arrive exactly after the t=10 data. The t=7 should be sent and be received earlier than the t=10 data but it can happen because of lost network connection. So the order of the data coming to the thingsboard rule chain is broken.

Actually, I don't need a realtime analysis. For example I can just calculate the analytics every a single day. I can call the Flespi REST API to get the ordered data and then post the data on by one to the thingsboard REST API. But I'm afraid that this is not the best solution.

Do you have any suggestion?

Thank you

    • Edited

    ajimehji we can suggest you to use flespi analytics engine! It has no such problem, each new message from device initiates analytics recalculation, it has no problem if device sends some message from blackbox. You can describe your analytics task and flespi team can advice you how to tune calculators to achieve your goal.

    Another option: flespi streams accumulate messages to be delivered to target platform if it is disconnected. And once platform is back online - flespi sends accumulated messages. So you may somehow disable thingsboard platform (e.g. by using proxy channel between stream and TB) and enable this connection once a day, so flespi will deliver a batch of accumulated messages. However I can't guarantee that flespi stream will deliver messages in chronological order. So you may try it, but I am not sure that it'll work. So this looks more like dirty hack :)

    The best approach is not to use dirty hacks, but solve problems in clear architecture way: remaster analytics architecture on TB side to exclude black-box messages issue, but I can't advice on this. Or use flespi analytics that natively process devices messages and has no such an issue.

    baja

    Thank you for the reply. The calculation is quite complex.

    So I would like to have a trip. A trip is defined by a trip from the pit to either one of the ports (it can be A or B or C) and goes back again to the pit. On each trip, I have two statuses which are shown by the blue and green lines. The blue indicates the "loaded" status and the green line indicates the "empty" status.

    So in each trip, I would like to calculate the average of the speed, the average of the speed for "loaded" status and "empty" status.

    I have tried the Flespi analytics but I can't figure it out

      • Edited

      ajimehji that's easy
      create calculator:
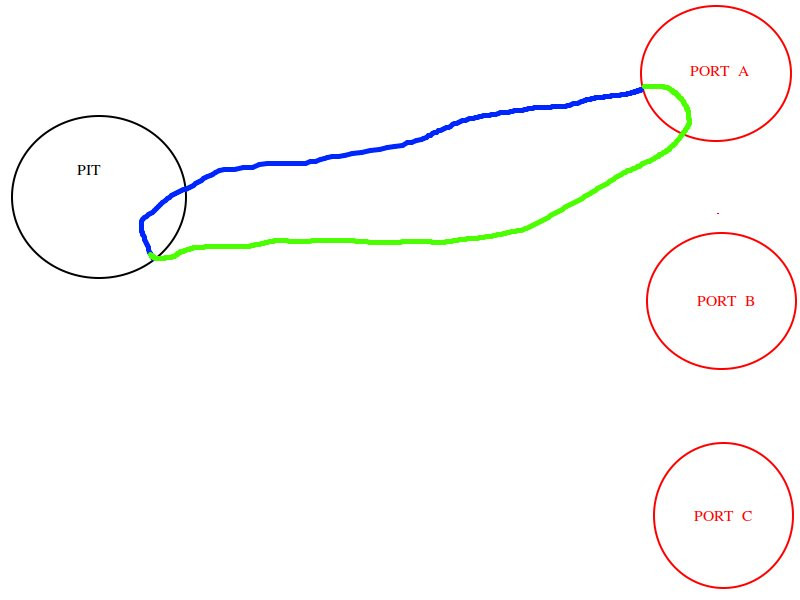
      selector: geofence of 4 circles, inverted: true (to detect trips when device is outside geofences)
      counter:

      • geofence - to know which of circles was the origin
      • route - to visualize it in toolbox
      • expression - summary - mileage
      • interval - trip average speed counted by formula (mileage / duration) * 3600 (or you can count average speed by expression - average position.speed reported by the device)
      {
        "intervals_ttl": 31536000,
        "update_delay": 30,
        "update_period": 31536000,
        "messages_source": {
          "source": "device"
        },
        "name": "pit-port",
        "selectors": [
          {
            "geofences": [
              {
                "center": {
                  "lat": 52.307282,
                  "lon": 9.860821
                },
                "name": "pit",
                "radius": 0.1,
                "type": "circle"
              },
              {
                "center": {
                  "lat": 52.322538,
                  "lon": 9.848054
                },
                "name": "port",
                "radius": 0.1,
                "type": "circle"
              }
            ],
            "invert": true,
            "merge_message_after": true,
            "merge_message_before": true,
            "name": "pit",
            "type": "geofence"
          }
        ],
        "intervals_rotate": 0,
        "counters": [
          {
            "name": "geofence",
            "type": "geofence"
          },
          {
            "name": "route",
            "type": "route"
          },
          {
            "expression": "mileage()",
            "method": "summary",
            "name": "mileage",
            "type": "expression"
          },
          {
            "expression": "(mileage / duration) * 3600",
            "name": "trip.speed",
            "type": "interval"
          }
        ]
      }

      You can write to flespi chat (top right corner of your flespi.io account) if you'll need some assist while implementing this

      baja Wow thank you! Amazing answer!

      Can I combine the green trip and blue trip as a single trip?

        ajimehji if you want to combine both trips into one you can use geofence selector with invert: true option to catch all trips out of geofence.

          shal Thank you for the answer, but what is the difference with the baja's answer? baja's answer use inverted geofence

            4 days later

            ajimehji there is only one difference - each separate calculator can count all trips outside 1 geofence. So that way you can combine both green and blue trips. In baja's answer you will have them separated. But in general - yes, almost no difference in replies)

              Write a Reply...