Do not find any graph widgets to display historical data, I'm right ?
Is it planned for the future, so to use the MQTT Tiles more or less like an IoT dashboard ?
Graphs
Yes, we are thinking about chart widgets, and at some point we will add this feature.
But at the moment there are no chart widgets in mqtttiles
Thank you for your suggestion. ;)
Little advertisement ,
In Hazer we have added feature for charts
There are plenty of JavaScript libraries or reporting tools out there that can be used to create your own reporting widgets from the flespi data.
JohnG
Yes, of course we know that. But the main reason we haven't added chart widgets yet is because the data for historical charts must be prepared, collected and stored in a specific format. Drawing is not a problem when the data is prepared, but now the question is precisely in preparing the data.
In the near future, I think we will add charts in a fairly simple implementation, without storing historical data on the server side, just plotting in real time. But our goal is real historical charts with server side storing.
Hello,
did you get any progress on that topic?
Thank you.
Nicolas
As I see, the Hazer app is proprietary,
so I would love to see the progress for MQTT Tiles.
bam80 I believe we will not do this in 2024. But you are welcome to fork MQTT Tiles to create your own version with history access or event create a pull request with such functionality.
Also much better option for you can be our Grafana plugin which allows you to render information from device messages (and we are working to add more data there from flespi entities - from containers, accounts, calculators, logs, etc). Its open source and you can influence its development if you wish ;-)
shal thank you for the invitation, I'm newbie in WEB development (to be precise, I'm not a WEB developer at all, as I work with Qt/QML/C++ tech), but I have some community (small yet) which seems emerging, so hopefully we could contribute one day.
About Grafana, it looks nice but might be not exact instrument I need.
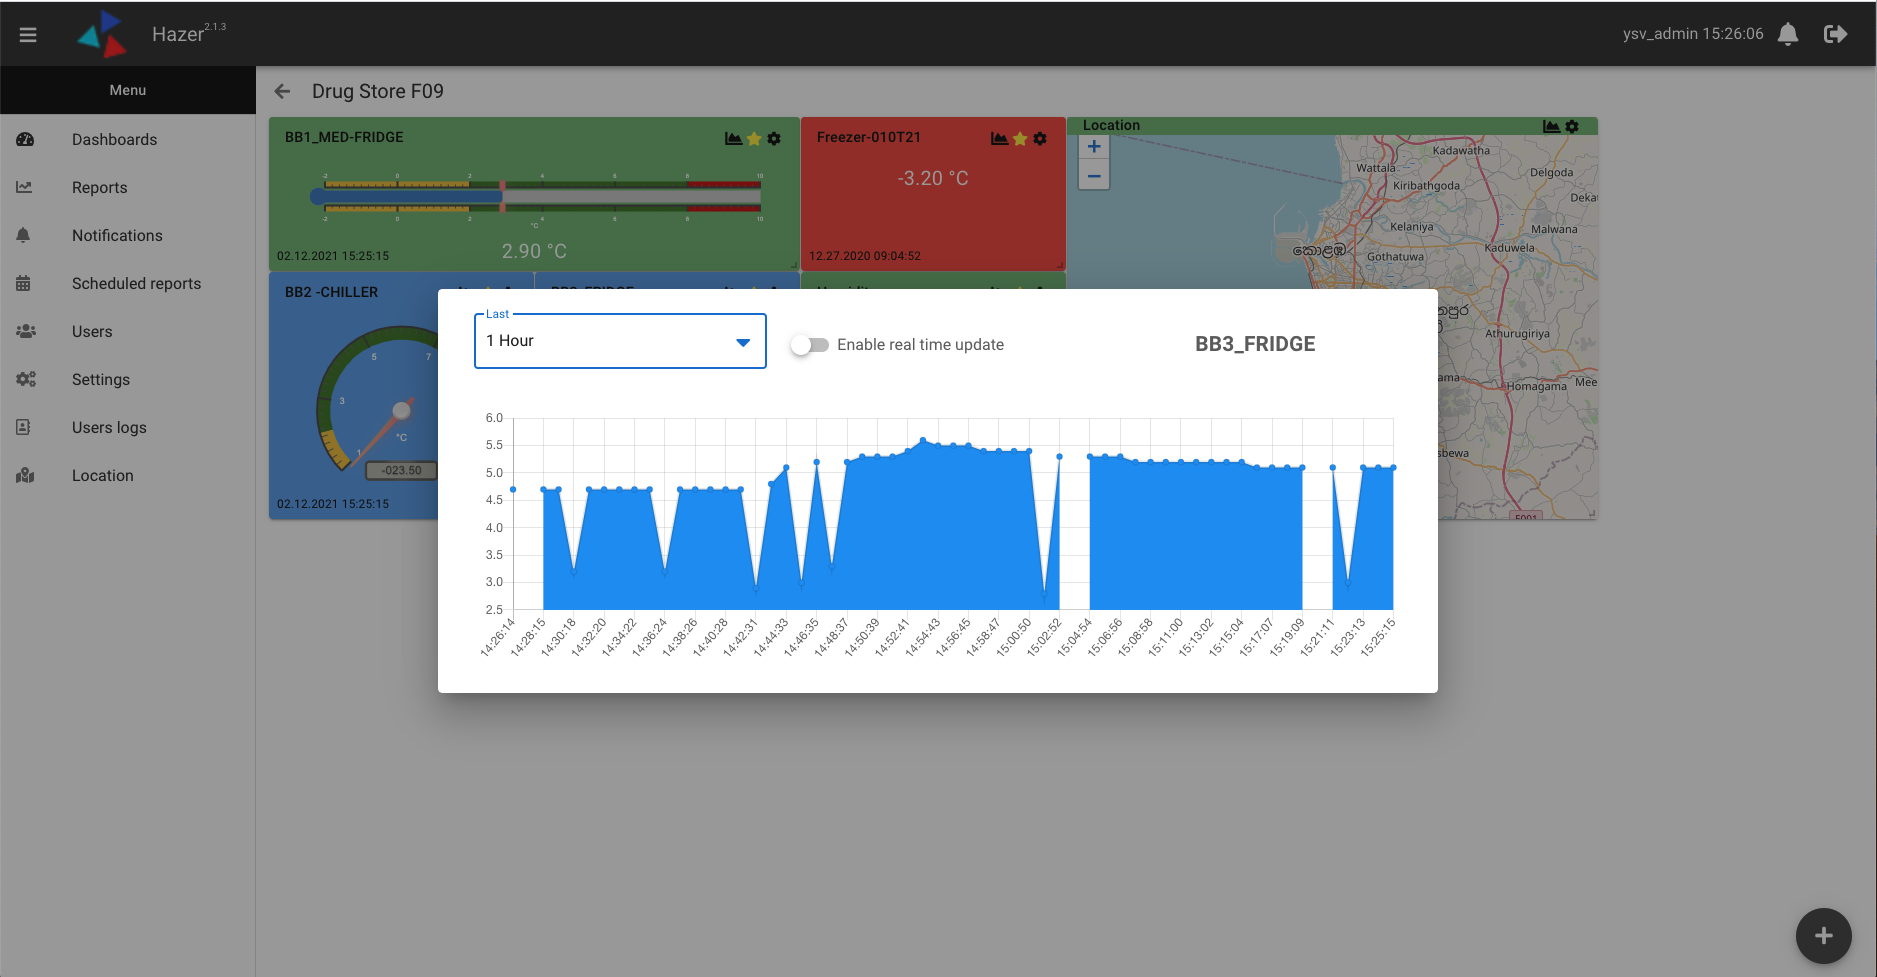
My task for now is a thermostat, so I need a dashboard with all the widgets I might need, graphs included.
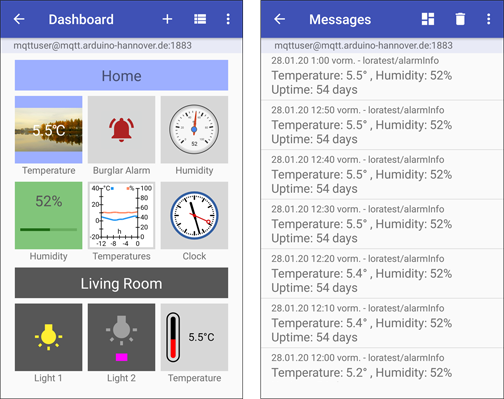
Working prototype is here, but it's just ugly Android app with proprietary server behind which imposes a lot of restrictions, so it's what we would like to avoid.
Still, it has graphs:
https://github.com/RadioShuttle/MQTTPushClient_Android
The graph widget is just a basic HTML/JS so maybe we could adopt it for MQTT Tiles, too:
https://github.com/RadioShuttle/MQTTPushClient_Android/blob/master/app/src/main/res/raw/cv_line_graph.html
I bet you have better idea how to do graphs, though :)
dexif In the near future, I think we will add charts in a fairly simple implementation, without storing historical data on the server side, just plotting in real time. But our goal is real historical charts with server side storing.
In my understanding, for the most common cases the solution for the history data server side storing is pretty straightforward and it's name is MQTT Persistent Sessions:
https://www.hivemq.com/blog/mqtt-essentials-part-7-persistent-session-queuing-messages/
Did you consider that?
bam80
You can find simple widget example here: https://github.com/flespi-software/examples/blob/master/mqtt-tiles-widgets/iframededebug/index.html
Here you can find simple explanation how to configure iframe widgets: https://flespi.com/kb/mqtt-tiles-widgets#iframe
This is board with configured widget that you can import to your MQTT Tiles